Any money spent within an organisation or business requires accountability to the various stakeholders (Ewing 2016), thus marketing expenses are viewed as an investment that pays returns, although many marketers oppose this concept (Ewing 2016). As John Wanamaker so accurately put it “half the money I spend on advertising is wasted; the trouble is I don’t know which half”. So finding out what works and what doesn’t will assist marketers in determining best value for money marketing (Sharp, B. 2013). So how you ask? In the following we will take a look at various marketing metrics used to evaluate marketing success, and relate them to the success of Lego’s marketing initiatives.
Financial Metrics
Financial metrics include profit contributions, profit margins, return on investment (ROI) and Customer Life Time Value . These measures aim to show the financial benefit of marketing. Return on investment is the most popular of these metrics and the definition is clearly understood through the following equation:
ROI = (Returns – Investment)/Investment
So basically if we were to assume that Lego invested $1 billion on their marketing mix then their ROI would have been $6.2 on every $1 spent on marketing in 2003 (refer figure 1). However, in 2013 their ROI would have been much more attractive at $24.4 on every $1 spent.
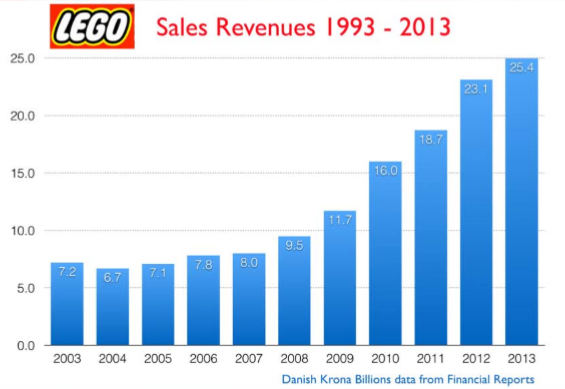
Figure 1: Finiancial Metric – Sales Revenue/Profit Contribution
The main flaws of ROI is that it fails to show the value of marketing on retaining existing market shares (Sharp 2013). ROI does not tell us what would have happened without marketing. Ambler and Roberts (2008) argue that marketing is like a maintenance item such as cleaning or gardening. It is something that is a need and therefore not an investment.
Furthermore, smaller marketing campaigns tend to yield a better ROI ratio as opposed to larger marketing campaigns (Sharp 2013). However larger marketing campaigns yield larger overall profits; which is what shareholders require. Therefore using ROI as a measure leads to marketers using smaller marketing campaigns.
Additionally, ROI depicts marketing campaigns that target existing customers as being more successful than campaigns that target new customers. A successful business must target both new and existing customers, however ROI measures may discourage marketers from attracting new customers (Sharp 2013).
Another issue with ROI is that it is generally calculated on an annual basis. In some cases, marketing campaigns don’t yield returns until many years into the future. For example, Lego invested heavily into the marketing of “Lego Factory” in 2005 however they only reaped the rewards from this investment from 2006.
Buying Behaviour Metrics
Buying and Behaviour Metrics aim to discover what customers do. Some of the metrics include: sales, market sharmarket share, market penetration, purchase frequency, share of category requirements (SCR), Solely (100% loyal customers), Retention rate, Customer complaints and recommendations. Figure 2 below shows Lego’s success with regards to their market share.
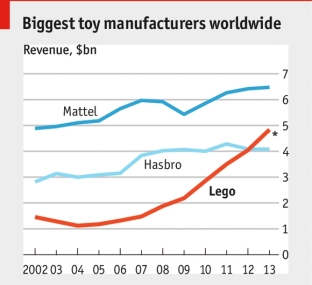
Figure 2: Buying Behavior Metrics – Revenue
It clearly depicts that the marketing campaigns conducted in 2002-2004 did not reap rewards until 2007. By 2012, their revenue and market share was ahead of Hasbro. Furthermore, during the recession of 2008 Lego maintained their expenditure on marketing. This expenditure is what saw them grab a large market share during this tough period. Theory suggests that maintaining expenditure on marketing during tough economic times actually benefits the company in the long term (Ewing 2016). However, in business the opposite occurs; marketing is still top of the list for funding cuts during tough times (Ewing 2016).
Memory Metrics
Memory metrics aim to discover what customers think and feel about a product or brand (Sharp 2013). This includes: brand awareness, brand image associations, mental availability, attitude, customer satisfaction , service quality, intention to buy and recommendation. The primary source of these metrics is via the use of surveys. Although it is noted that it may not be all that accurate because people don’t always report what they do.
LEGO undertook such a survey after the re-launch marketing campaign of their “Star Wars” sets. The main event of this marketing campaign was organised in Time Square New York where Lego promised to revel a secret. Leading up to the event kids and their parents were encouraged (with the use of prizes) to visit stores or use their own LEGOs at home to construct whatever they thought was the secret. Clues were given away on the “Yoda Chronicles” mobile app, Facebook, Lego YouTube Videos and adds that ran on the cartoon network. Once they constructed what they thought the secret was they were asked to post photos of it on Lego’s microsite. This made the kids become part of a digital nurturing stream in which the company could continue to engage with them until the time of the big reveal (O’Loughlin 2014).
This process revealed key memory metrics as follows:
- 66% of consumers unfamiliar with the “Yoda Chronicles” were aware of it by the end of the campaign (brand awareness)
- 56% said they were likely to purchase LEGO after the event (intention to buy)
- 90% said they would share the experience with friends and family (recommendation)
(O’Loughlin 2014)
Financial metrics later revealed the following:
- 43 % rise in sales of the LEGO “Star Wars” line month over month after the event
- 3% increase in sales
(O’Loughlin 2014)
Customer profile metrics
Customer profile metrics are used to identify who the customer is. This includes things such as age, gender, income, location etc. (Sharp 2013). Lego was able to gather this information by having customers log-in to the microsite such as the one mentioned earlier. In turn this information assisted marketers in segmenting targeting and positioning (Lacobucci, 2014).
Lego was gathering this information for a long time and not only from the above event (Ringen 2015). This is why they added products such as DUPLO, LEGO and FRIENDS which are catered for young females. This in turn was a major reason as to why Lego was able to increase its market share (Ringen 2015).
Marketing behaviour metrics
Marketing behaviour metrics refer to the documentation of a company’s marketing activity and its competition. This will allow the company to understand what works and what doesn’t for making better informed decisions about their future marketing activities. It is evident from the Ashcroft 2015 case study that Lego have stored marketing information over time; some of which are available to us and evaluated by others as shown in this site, this site and even this site.
Physical Availability
Refers to how easy it is for a customer to purchase a product or item. In the case of Lego it refers to whether the item is in stock and readily purchased from outlets regardless of where in the world you are. Lego have worked hard at ensuring supply meets demand by increasing their production facilities as shown in figure 3 below. Furthermore, numerous Lego Lands across the globe act as a point where kids can come and enjoy the Lego experience.
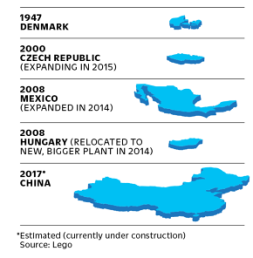
Figure 3: Physical Availability – Increasing production capacity
Conclusion
It is clear that Lego have evaluated their marketing strategies and know what works well for them, such as the advertisements below. Their success over the past 10 years is proof of this effort. However, the world is continuing to evolve and so is the competition. As such it is imperative that Lego continue to evaluate the success of their marketing campaigns so that they can continue to make good marketing decisions into the future.
By: Mayuraj Chandrakaran (212530654)
References
Ambler, T, & Roberts, J 2008, ‘Assessing marketing performance: don’t settle for a silver metric’, Journal Of Marketing Management, 24, 7-8, pp. 733-750, Business Source Complete, EBSCOhost, viewed 2 October 2016.
Anon, 2016. [online] Adespresso.com. Available at: <https://adespresso.com/academy/blog/lego-content-marketing-experience/> [Accessed 2 Oct. 2016].
Anon, 2016. 7 Secrets to the Lego Marketing Campaigns … Effective Marketing?. [online] Digital Spark Marketing. Available at: <http://digitalsparkmarketing.com/lego-marketing-campaigns/> [Accessed 2 Oct. 2016].
Ashcroft, J., 2015. The Lego Case Study 2014. [online] The Lego Casestudy. Available at: <http://www.thelegocasestudy.com/uploads/1/9/9/5/19956653/lego_case_study_2014.pdf> [Accessed 2 Oct. 2016].
Kolowich, L., 2016. Building a Playful Brand, Brick by Brick: The History of Lego Marketing. [online] Blog.hubspot.com. Available at: <http://blog.hubspot.com/agency/history-lego-marketing#sm.0000j4a2nj71zfocrfg2j34kq4wv4> [Accessed 2 Oct. 2016].
Lacobucci, 2014. Marketing Management. 4th ed. Mason OH USA: Cengage.
Mike Ewing, MPK732 Marketing Management, Deakin University, lecture 10, September 2016
O’Loughlin, S 2014, ‘THE MEASURE OF SUCCESS’, Event Marketer Magazine, pp. 50-54, Business Source Complete, EBSCOhost, viewed 2 October 2016.
Ringen, J., 2015. How Lego Became The Apple Of Toys. [online] Fast Company. Available at: <https://www.fastcompany.com/3040223/when-it-clicks-it-clicks> [Accessed 2 Oct. 2016].
Sharp, B. (2013) Marketing Metrics Marketing: Theory, Evidence, Practice. Oxford University Press, Melbourne, Australia.